Context Is big data a big deal or is it mostly big hype? This question leaves most businesses wondering – “Just how much value can data analytics achieve?”

The answer might surprise you!!

Everything today is generating an unprecedented amount of multi-structured data:

Smart homes, the Internet of Things, social media, mobile application, websites and other technologies. This "big data" has the potential to transform businesses and industries and unleash immense value. Its is a catalyst to help companies transform themselves, decide which technologies to use, and build ecosystems of partners and vendors. Data now, has become a strategic asset that can give you the edge you seek.

Your data by itself is #N/A. But by applying advance analytics we can provide with you the insights that can jolt a transformation in a way you do your business

EXECUTION

data

Data

We find a way to get the data to provide you meaningful analysis using tools like GA Tag manager, Tealium etc.

vision

Vision

To drive out detailed & valuable insights for an effective strategy execution.

Insights Tools

Tools and Insights

Big data is technology-enabled, and we choose the right technology platforms (R, Python Power Bi, Big Query, Google Analytics) combined with the analytical experience (high-end data modelling) necessary to make appropriate technology & business decisions.

Execution

Execution

Insights left on the shelf are worthless. Our teams provide you the details inferences in the form of customized reports tailored as per your needs.

CUSTOMER INCENTIVE

The data warehousing and analytics technologies have been upgrading at a much higher rate in the recent past. Still, most of the organizations have not been able to convert their data pools into strategic assets through analysis.

Our Data Analytics services employ our strengths in industry knowledge and analytical techniques to unlock the full potential of the available information. We have developed a wide arsenal of tools and methodologies which help us analyze large volumes of information in a rigorous manner.

We provide data-driven, action-oriented solutions through statistical data mining (R/ Python), cutting edge analytics combined with a consultative approach.

analytics-customer

TECHNOLOGIES / CAPABILITES @AvideConsultant

R & PYTHON

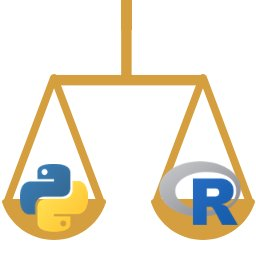
Both Python and Rare are amongst the most popular languages for data analysis and have their supporters and opponents. While Python is often praised for being a general-purpose language with an easy-to-understand syntax, R’s functionality is developed with statisticians in mind, thereby giving it field-specific advantages combined with great features for data visualization.

Both have been developed with scalability at their core: The Development teams have put a lot of effort into making their language available for different types of hardware and software. This means that both are available for Windows, Unix systems (such as Linux), and the Mac, and both can connect to virtually any data source.

R and Python

POWER BI & TABLEAU

Both are top Market leaders in data visualization and analytics game with PBI picking up the pace with a continuous barrage of new features and updates every month since 2017. Data is More Accessible Than Ever Before Power BI /Tableau were built to integrate with ~60 common software solutions your business already uses and pulls data into a centralized, easy-to-digest dashboard. Here are just a few:

This means data can be extracted directly from cloud, on premise, and hybrid systems. Very little engineering or IT resources are needed to implement Power BI/Tableau. In fact, some instances don’t require any engineering at all. Managers simply need to create an API key and plug it into the software. With Microsoft systems (such as Office 365), using Power BI feels natural. It integrates easily with Office 365 Groups and Microsoft Teams. Without steep build costs or extensive training, the financial benefits of implementing Power BI/tableau unlike R/Python are immediate. Access controls can be through Active Directory (AD), the same control panel your organization uses for other Microsoft solutions. We can control which team members have access to specific rows of data on reports. This means “Only show Steve from Accounting rows 6-10,” while executives could see the entire report.

GOOGLE ANALYTICS
google analytics

Google Universal Analytics – Web and Marketing Analytics Improvement lies within the perimeters of measurement. In simple Google analytics lingo, ‘what you can’t measure, you can’t improve’. Without data we’re just another entity with an opinion. I have visitors but no sales on my website. Why is this happening?

Users are interacting with my website for only a couple of seconds. What can we do to fix it? How are users interacting with my website? I want to understand their interaction in much greater detail. What are bounce rates? Is a high bounce rate good for my website or will it harm my website/ rankings and in turn SEO?

Mine the data, extract business intelligence, or else it will feel like pushing against a wall that doesn’t budge! Use Universal Analytics to measure business metrics such as leads, traffic, sales and events to extract insights into user behavior and business growth opportunities. Both, web and marketing analytics are important for your business success. (Drop down form for name, email, website and phone)

WHAT WE DO?

We review your website using an advanced audit to find any issues. The audit includes an in-depth analysis of the web analytics configuration and tracking cross-reference to your requisites. Our advanced tracking and configuration includes e-commerce implantation, cross-device tracking and related data capture,using custom events and tag hierarchies for your business.

OUR PROCESS

HOW DOES IT BENEFIT YOU?

Analytics services give you a full view of consumers across various channels. It also helps your business to understand your customers and market behavior best and work accordingly. You can also leverage web analytics to improve your site’s performance while through digital analytics enhance your marketing campaigns.

SOME INTERESTING FACTS

Google Analytics is used by somewhere between 10 million and 25 million websites worldwide

39% companies present on Social Media don’t use a web analytics tool

50% of business websites (both large and small) use Google Analytics

RPA – UIPATH

“Increase efficiency and reduce costs” – this is pretty much the tagline for robotic process automation across the board. But how does RPA increase efficiency, exactly? It’s easy to think about how physical robotics improved efficiency on the factory production line, and RPA has a similar effect on digital business processes. How? • Robots operate 24/7 - No Sick leaves or half days!

  • Faster processing times - how fast? – more than you think! (hours to mins)
  • Self QC
  • Human Efforts can be redirected to strategy from mundane and redundant tasks.

RPA can make a difference on multiple levels and not only efficiency gains.

MS OFFICE-SUITE/ EXCEL-VBA

A VBA application has the power to bring automation to your business procedures. You’ll be able to access the information you need no matter where you are in the world. You can send a 1000 emails with customized templates and attachments with a click of a button. You won’t have to run back to the office to retrieve valuable data from your desktop either. In addition to consolidating and retrieving your data in the cloud there’s also endless opportunities to build efficient business processes to do more with the data. It is the best tool available for data modelling and quick/ad-hoc analysis.